Data exploration.
Data exploration involved looking for 0-sum rows in treatments, evaluating outliers, and assessing the normality and variance of the data. After assessing for 0's, it was determined that the Stavely site had many plots that didn't have cryptogramic biocrust cover. This was not an effect of the treatments, as Stavely was observed to have little biocrust cover during plot establishment in 2016. As treatment affects on biocrust cannot be evaluated without a biocrust, Stavely will be removed from forthcoming analyses.
Biocrust cover, richness and diversity
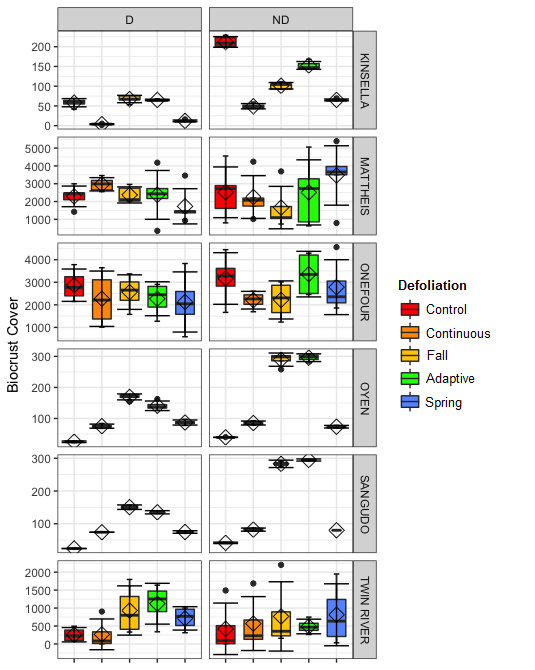
Figure 4. Biocrust cover by site and by treatment. Error bars with notches represent standard deviation from the mean, and the mean is represented by a diamond. Un-notched whiskers are representative of +/- IQR*1.5, the coloured box represents the IQR, and the median is represented by a horizontal line within the box.
|
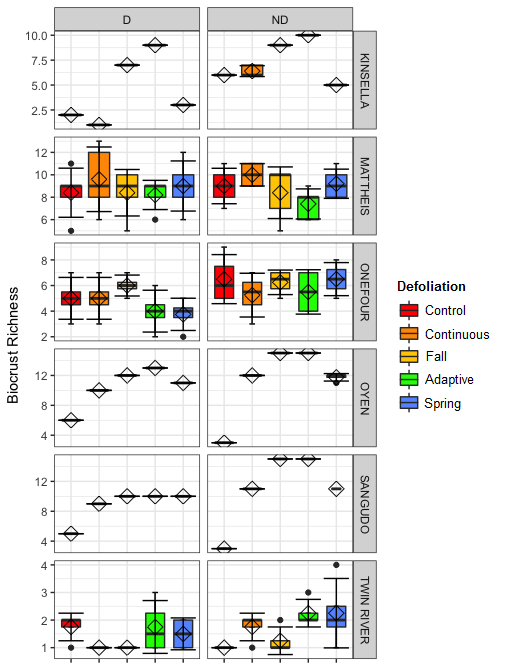 Figure 5. Biocrust species richness by site and by treatment. Error bars with notches represent standard deviation from the mean, and the mean is represented by a diamond. Un-notched whiskers are representative of +/- IQR*1.5, the coloured box represents the IQR, and the median is represented by a horizontal line within the box. Figure 5. Biocrust species richness by site and by treatment. Error bars with notches represent standard deviation from the mean, and the mean is represented by a diamond. Un-notched whiskers are representative of +/- IQR*1.5, the coloured box represents the IQR, and the median is represented by a horizontal line within the box.
|
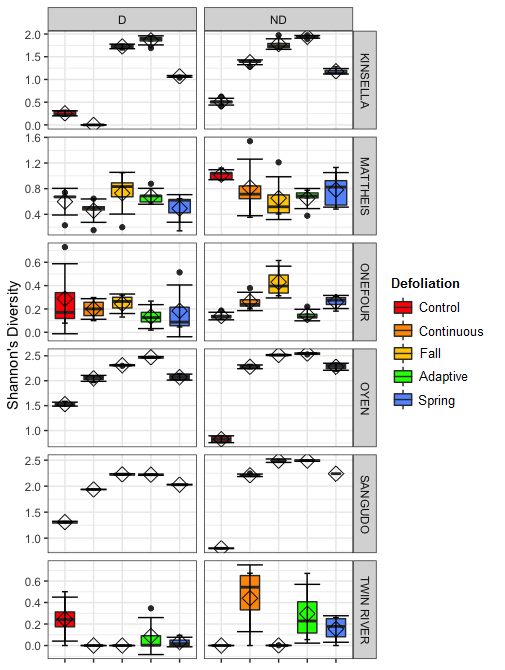
Figure 6. Shannon's Diversity by site and by treatment. Error bars with notches represent standard deviation from the mean, and the mean is represented by a diamond. Un-notched whiskers are representative of +/- IQR*1.5, the coloured box represents the IQR, and the median is represented by a horizontal line within the box.
|
Biocrusts at Mattheis and Onefour had the highest cover, and biocrust cover appears to differ between treatments at Kinsella, Oyen, and Sangudo while staying consistant at Mattheis, Onefour, and Twin River (Figure 4). Mattheis had biocrusts with the greatest species richness, and richness appeared to differ between treatments at Sangudo, Oyen, Kinsella, and Twin River, while staying fairly constant at Mattheis and Onefour (Figure 5). Shannon's diversity varied by site, and Kinsella, Oyen, Sangudo, and Onefour appeared to exhibit changes in Shannon's diversity with treatment (Figure 6).
Biocrust constituents.
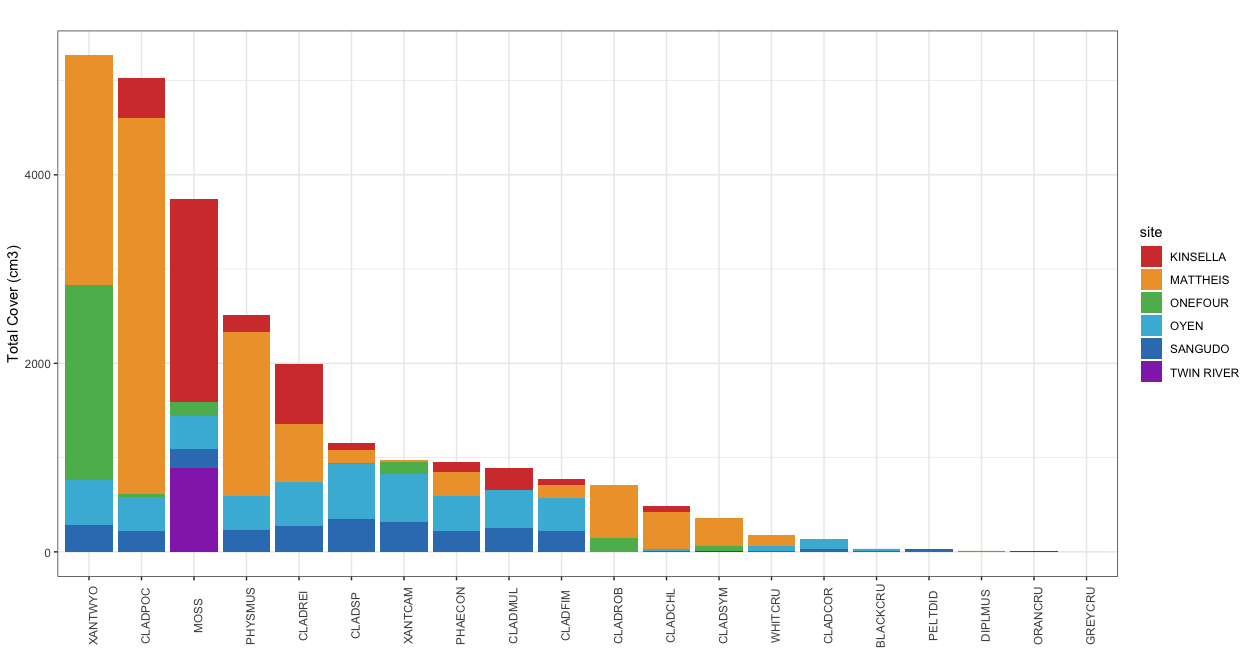
Figure 7. Chart of biocrust constituent total cover in cm3 by site.
Biocrusts at Kinsella were moss-dominated, but contained smaller amounts of Cladonia pocillum, Physconia muscigena, Cladonia rei, Cladonia chlorophaea, Cladonia multiformis, and other Cladonia species. Mattheis biocrusts were lichen-dominant, with the majority of the cover consisting of Cladonia pocillum, Xanthoparmelia wyomingica, Physconia muscigena, Cladonia rei, Cladonia robbinsii, Cladonia chlorophaea, Cladonia symphycarpa, Phaeophyscia constipata, Cladonia fimbriata, and various crust lichens. Soil crusts at Onefour were dominated by Xanthoparmelia wyomingica and Xanthoparmelia camtschadalis, Cladonia robbinsii, as well as mosses. Biocrusts at Oyen consisted of Xanthoparmelia wyomingica, mosses, Cladonia rei, Cladonia pocillum, Physconia muscigena, Xanthoparmelia camtschadalis, Phaeophyscia constipata, Cladonia fimbriata, Cladonia multiformis, and Cladonia cornuta. Sangudo had a biocrust species composition similar to Oyen, Twin River had biocrusts consisting mainly of mosses, and most plots at Stavely were observed to not have cryptogramic soil crusts (Figure 7).
Exploratory NMDS Ordinations.
Exploratory NMDS' of site biocrust communities grouped by drought, defoliation treatment, combined treatment, and site were completed to explore overall trends (Figure 8-11). Exploratory NMDS of sites ordinated in species space and colour-coded by treatments didn't reveal any overall trends in treatment, but Kinsella, Oyen and Sangudo sites tended to be similar. Sites are influenced by different environmental factors, have different species makeup, and likely respond to treatments differently. As such, sites will be analyzed separately for treatment effects.
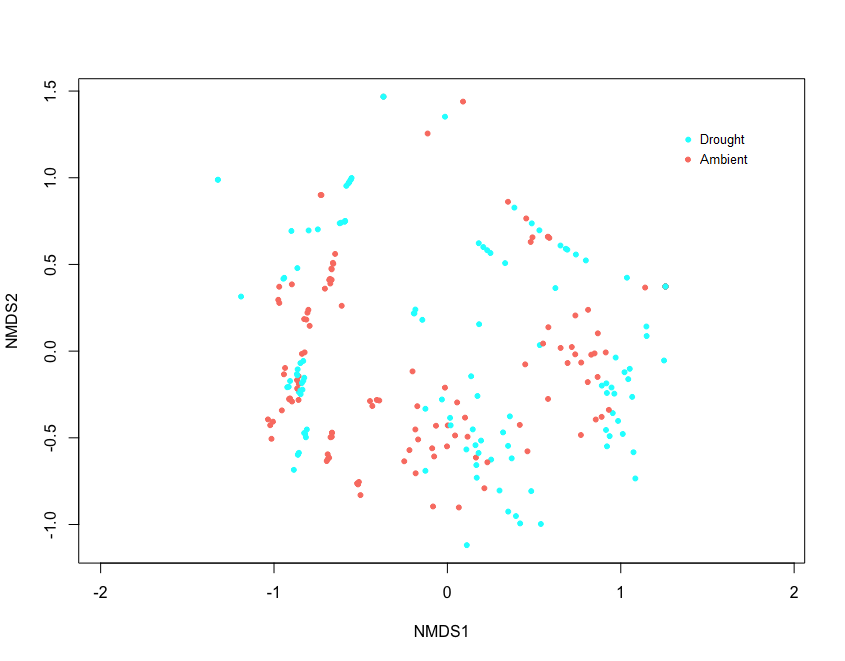
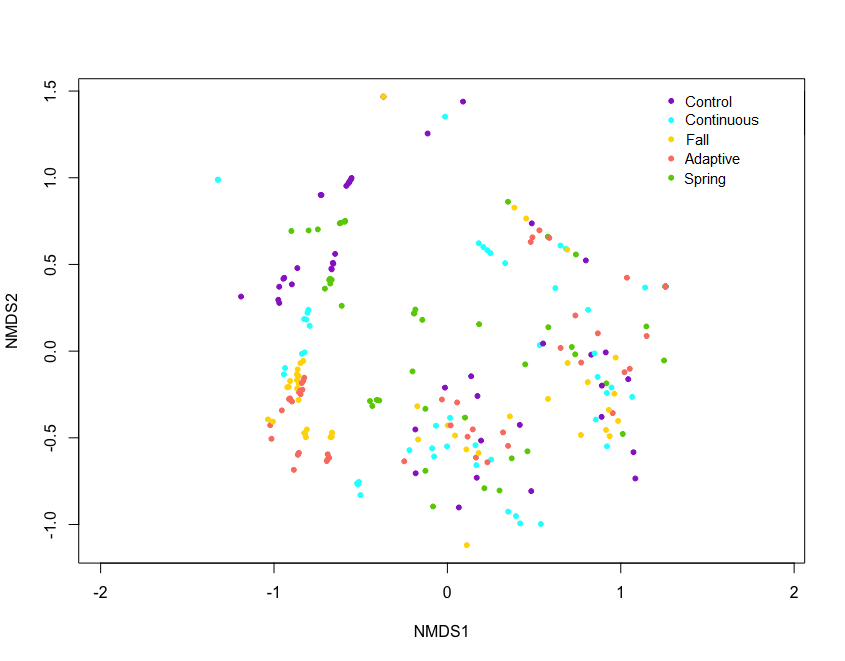
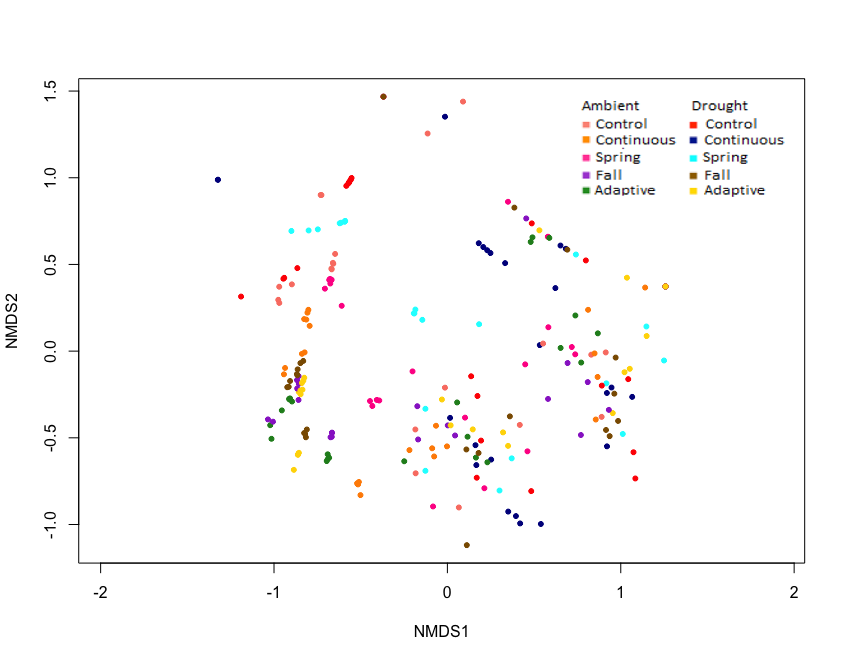
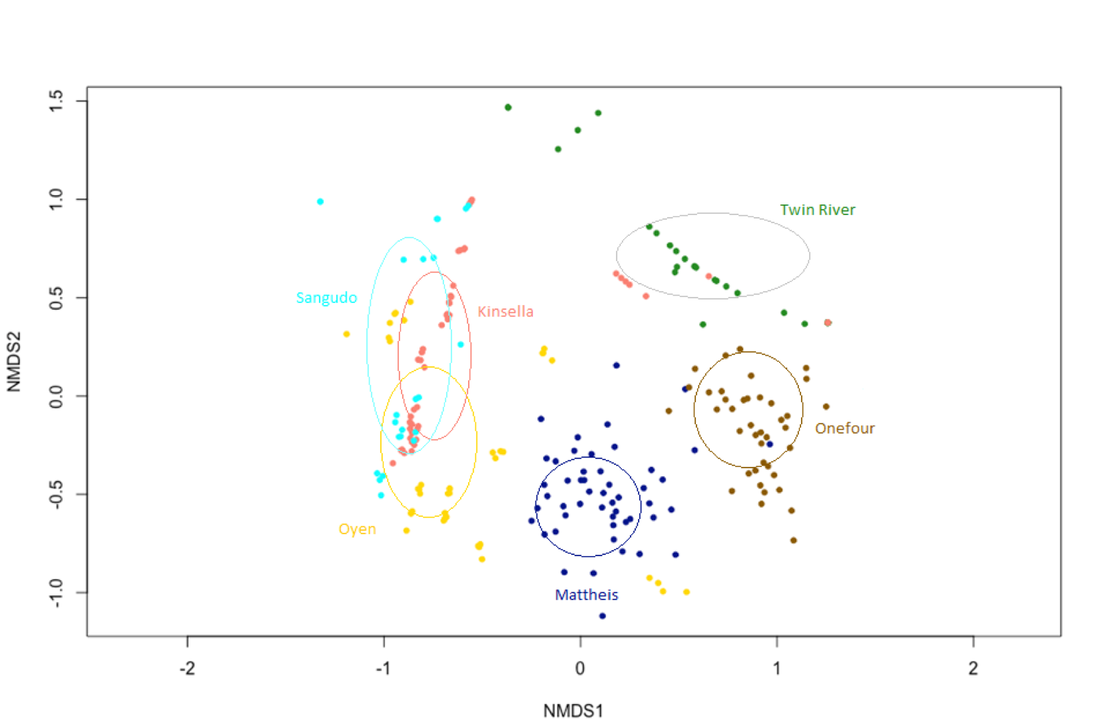
Figures 8-11. Click on figures to view descriptions,
Disclaimer: This website was created for a class project for RENR 690 at the University of Alberta. Results presented are based on a randomly generated dataset.
